Behavioral Analytics
Snowplow Architecture
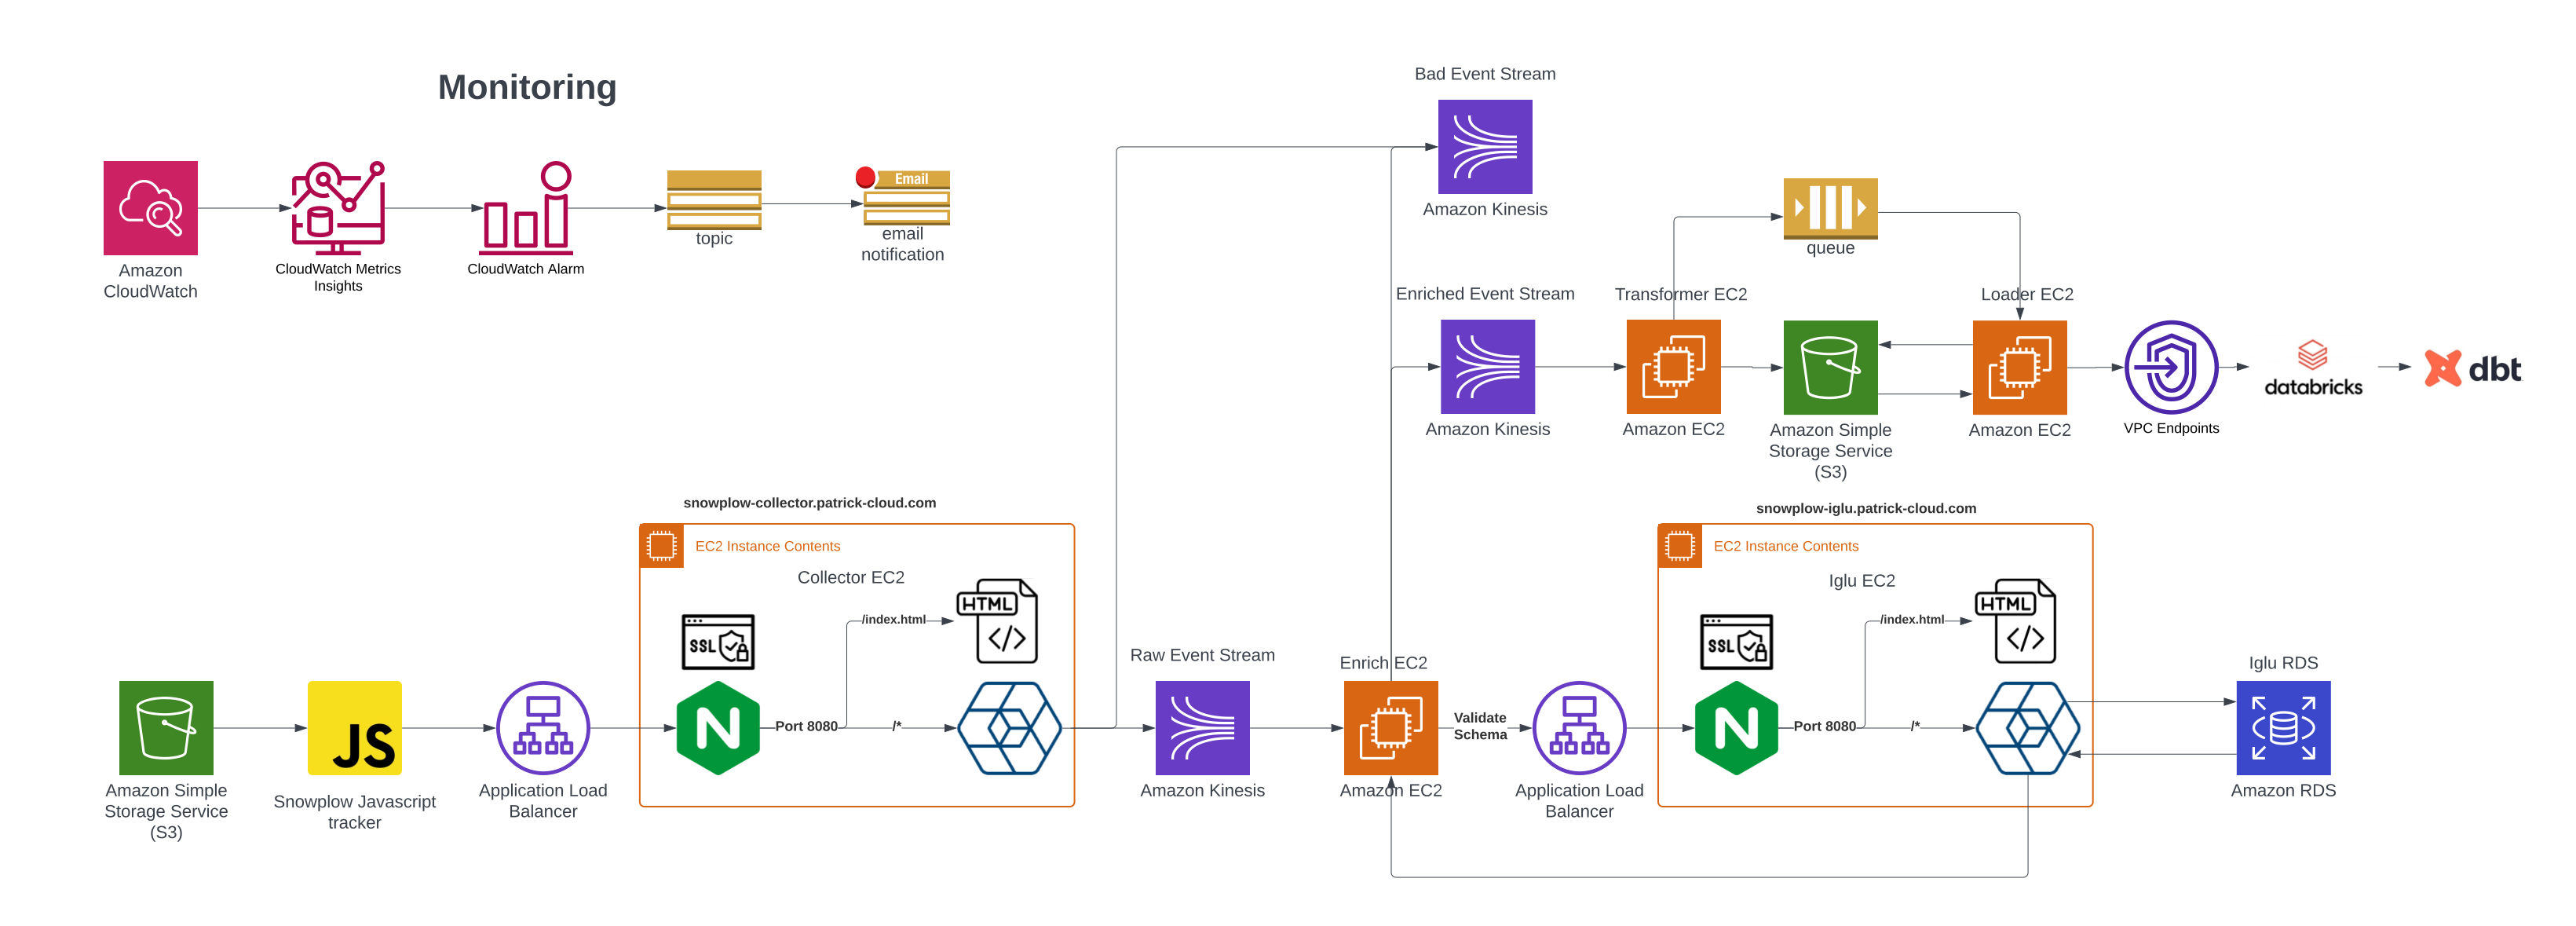
A first-party event pipeline — collector, schema registry, enrichments, and a custom event, landing in the lakehouse.
Architecture Decisions
I customized the Collector and Iglu modules so a single ALB handles all patrick-cloud.com traffic. Nginx runs on the server to allow SSL traffic from the ALB to the EC2 via self-signed certificates — listening on 443 (and 80, redirecting to 443) and forwarding to 0.0.0.0:8080 where the Snowplow application listens.
All EC2 instances sit in private subnets, reachable only through the ALB. Kinesis, SQS, SNS, and Secrets Manager are encrypted with a CMK for fine-grained IAM; SQS and Kinesis have access policies defined on top.
Prometheus scrapes metrics from the Collector application, exposed on port 8125.
Each application ships logs to Cloudwatch. A Cloudwatch metric filter on every log group watches for the pattern ERROR, with an attached alarm that emails on trigger.
- EC2 — error log detection, high CPU, low CPU
- Kinesis — put record success rate, get record success rate, age of message in stream
- SQS — age of oldest message, messages visible, messages invisible
- S3 — 4XX errors, 5XX errors
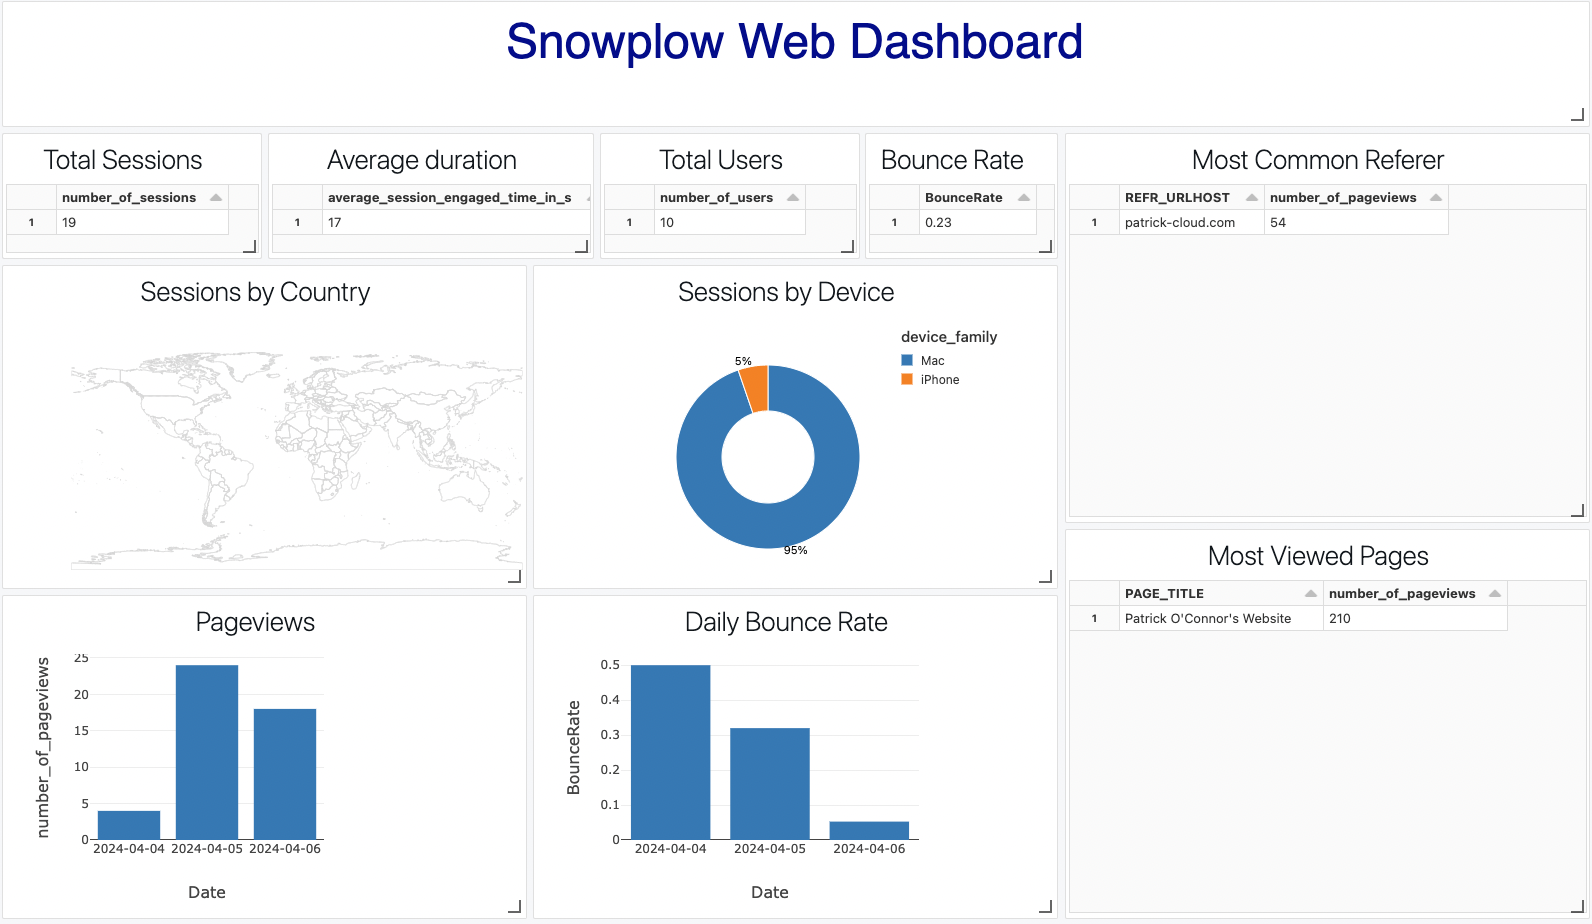
Data lands in the Databricks warehouse where dbt processes the event data into models. The dashboard below is built from a Databricks notebook.
Try It — Custom Event
I created a custom Snowplow event, Sample Input, that reads whatever you type below. It needed a custom schema added to my Iglu registry so the event would validate.
Events Tracked
The following events are collected by the JavaScript tracker.
Enrichments
Uses the ua-parser library to parse the user agent and provide information about the user's device.
Parses and analyzes all user-agent information of an HTTP request, extracting as much as possible about device and browser — device class (phone, tablet, etc.) included.
Computes a fingerprint of each event using the query string parameters.
Links events to marketing campaigns using the query string parameters.
Uses the referer-parser library to extract attribution data from referer URLs.
Consoles
snowplow-collector.patrick-cloud.com — Nginx directs traffic to index.html
snowplow-iglu.patrick-cloud.com — Nginx directs traffic to index.html